Bay-O-Net coordination curves determine whether a fuse clears a fault before the upstream recloser or breaker operates — and whether it does so with enough margin to survive normal system disturbances. When a fault occurs downstream of a distribution transformer, reading these coordination curves correctly is what separates a protection scheme that isolates a single transformer from one that blacks out an entire feeder. Getting this wrong either strands customers on nuisance lockouts or lets a fault linger long enough to damage transformer windings.
What Coordination Curves Show in a Bay-O-Net Protection Scheme
What a Time-Current Characteristic (TCC) Curve Plots
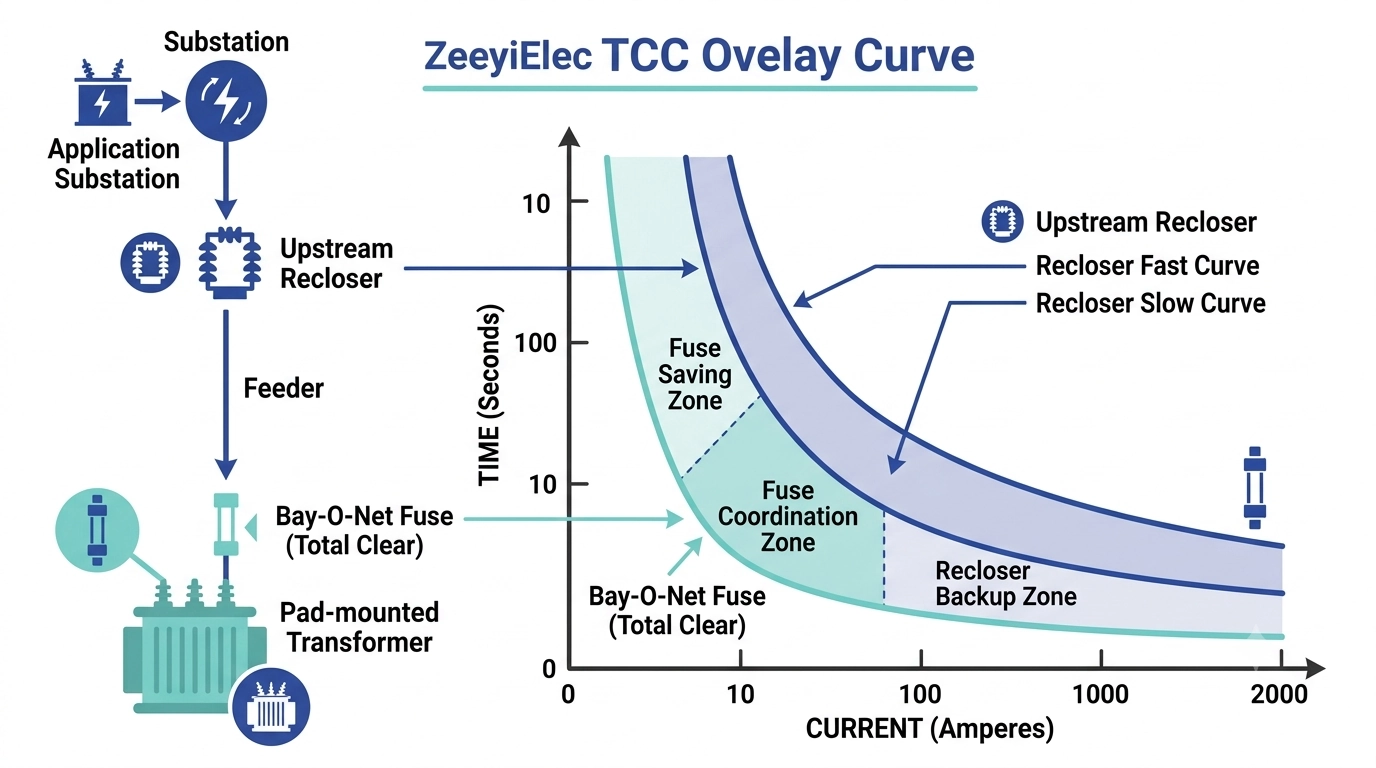
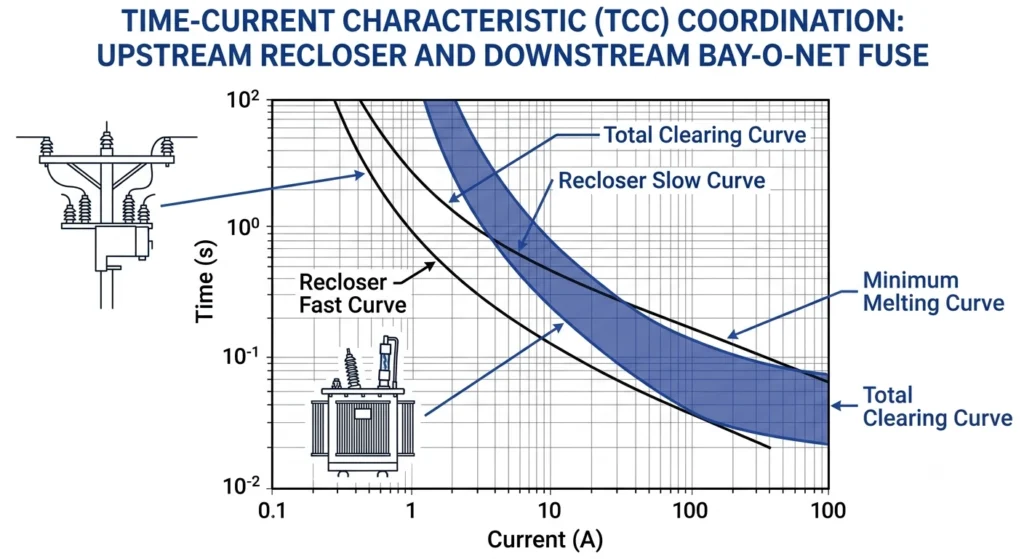
A TCC curve plots the time a protective device takes to operate against the current magnitude it experiences, almost always on a log-log scale. For a Bay-O-Net fuse link, the curve typically shows two boundaries: minimum melting time and total clearing time, separated by an arcing interval. At a fault current of roughly 500 A, a 15A-rated link commonly clears in the sub-second range, while at 3,000 A–3,500 A — near the practical interruption ceiling for expulsion-type Bay-O-Net links — clearing time drops to a few cycles. The upstream recloser’s curve is plotted on the same axes using its fast and slow (or delayed) operating characteristics, usually pulled from the relay’s programmed curve family rather than a fixed datasheet value.
Where the Bay-O-Net Link Sits Relative to Upstream Devices
In a typical pad-mounted distribution transformer protection scheme, the Bay-O-Net sits as the first line of defense against secondary-side and moderate primary faults, with the utility recloser or substation breaker acting as backup several hundred meters to several kilometers upstream. In field practice, engineers commissioning a new transformer connection often find the recloser’s fast-trip curve was set generically for the feeder rather than tuned to the specific transformer’s fuse rating — a mismatch that only surfaces once someone actually overlays the two curves rather than comparing nameplate ratings alone. IEEE C37.42 (Section 7, Time-Current Characteristic Requirements) sets the performance criteria for these curves, with the underlying test methodology defined in IEEE C37.41 — so requesting the underlying test curve, not just a summary table, is worth the extra step when precision matters.
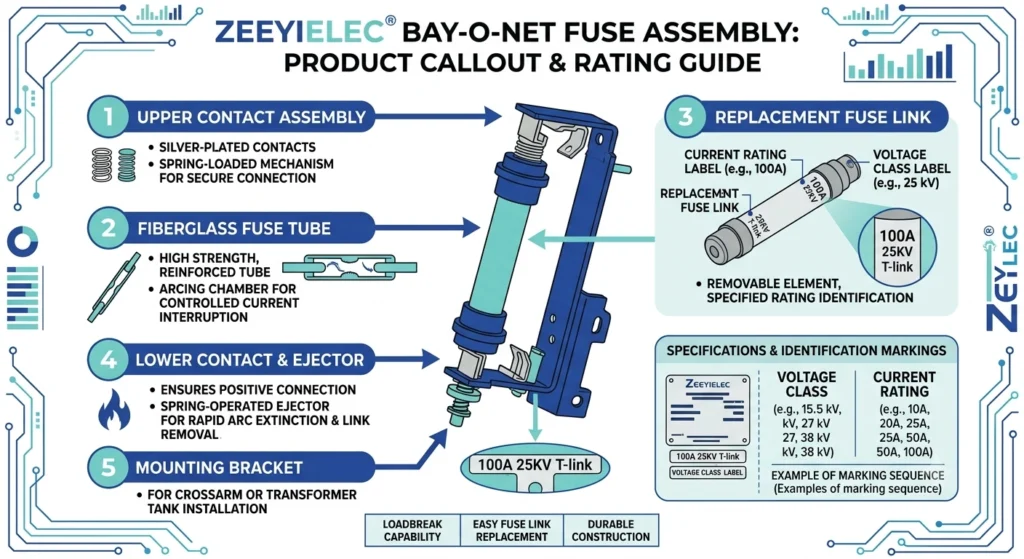
The Bay-O-Net fuse assembly product family referenced in coordination studies typically spans the 15/25 kV distribution class, with link ratings commonly available from 2 A up to 50 A depending on transformer kVA.
A time-current characteristic plot places the Bay-O-Net’s melting and clearing bands against the recloser’s fast and slow curves on shared log-log axes.
[Expert Insight]
Always request the fuse manufacturer’s raw test curve, not a summarized table — summarized data can hide arcing-interval width that matters at high fault current.
Recloser fast-curve settings are frequently feeder-wide defaults, not transformer-specific — never assume they were tuned for your installation.
A curve comparison based on nameplate ratings alone (kV, A) tells you nothing about actual time separation; only an overlay does.
Why Bay-O-Net-to-Recloser Coordination Matters in the Field
Coordination curve analysis can look like a paper exercise until a specific transformer starts causing feeder-wide outages. In field troubleshooting, miscoordination between a Bay-O-Net fuse and an upstream recloser tends to surface as one of two distinct symptoms, and the fix differs depending on which one is occurring.
Miscoordination Symptom 1: Nuisance Recloser Lockout on Transformer Inrush
When a distribution transformer energizes, inrush current can momentarily reach 8–12 times the transformer’s rated current for a fraction of a second before settling to normal load levels. If the recloser’s fast-trip curve sits too close to the Bay-O-Net’s melting curve at that current magnitude, the recloser can interpret a routine energization as a fault and lock out, dropping every customer on the feeder rather than isolating the single transformer. Field crews often report this pattern after a scheduled outage restoration, when multiple transformers re-energize in sequence and the feeder trips on the second or third pickup — a signature of a coordination margin that was adequate for one transformer’s inrush but not for cumulative loading.
Miscoordination Symptom 2: Fuse Fails to Clear Before Recloser Trips
The opposite failure mode is less visible but more damaging. If the Bay-O-Net’s clearing time at a given fault current — say 2,000 A–2,500 A — extends past the recloser’s fast-curve operating time, the recloser opens first, again taking the whole feeder offline for a fault that should have been isolated to a single transformer. Worse, if the recloser is set to reclose automatically, the transformer sees a second inrush-plus-fault event before the fuse has a chance to clear on the first attempt, which accelerates thermal stress on the fuse element and, in marginal cases, on the transformer winding itself.
Both symptoms trace back to the same root cause: the two curves were never actually overlaid and checked against real inrush and fault-current data for that specific installation, only compared by rated current or voltage class on paper.
Reading and Comparing Two Curves on the Same Plot
Overlaying Bay-O-Net coordination curves against an upstream recloser curve is a mechanical process, but the sequence matters — skipping a step is the most common reason engineers misjudge a margin that looks fine on paper but fails in the field.
Step 1: Plot Both Curves on the Same Log-Log Axes
Both curves must share identical current (x-axis) and time (y-axis) scales, typically current from roughly 10 A to 10,000 A and time from 0.01 s to 1,000 s. Mixing a manufacturer’s fuse curve plotted in one software package with a relay curve exported from another is a common source of visual misalignment — always confirm both curves reference the same base current and time units before comparing shapes.
Step 2: Identify the Fault Current Range of Interest
Rather than comparing curves across their entire range, mark the actual fault current window relevant to the installation — typically bounded by minimum fault current (often the far end of the secondary conductor) and maximum available fault current (usually at the transformer terminals). A distribution transformer might see a fault current range of roughly 800 A at the minimum end up to 4,000 A at the terminals, and coordination only needs to hold across that span, not the full curve length.
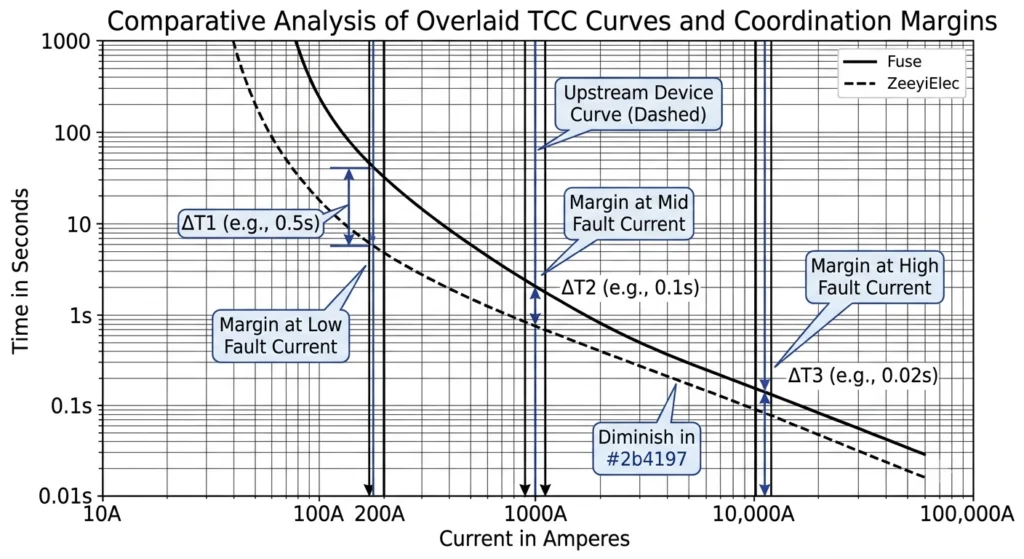
Step 3: Measure the Vertical (Time) Separation at Each Current Point
At several points across the fault current range, read the time value on both curves and note the gap. The Bay-O-Net’s total clearing time curve should sit clearly below the recloser’s fast-curve at every point in the range — not just at the endpoints, since curves can cross in the middle even when they look separated at both extremes.
Measuring vertical time separation at multiple fault current points confirms the Bay-O-Net clearing curve stays below the recloser curve throughout the range.
In field practice, engineers reviewing a coordination study for the first time often stop after checking the curves’ general shape and miss a narrow-margin crossing point buried in the middle of the range — this is why point-by-point checking across the full window, not just visual inspection, is standard practice on any project involving transformer accessory selection where protection coordination is a deliverable.
Setting and Verifying Coordination Margins
Once Bay-O-Net coordination curves are plotted and overlaid across the relevant fault current range, the remaining work is deciding how much time separation counts as “enough” and adjusting for conditions that shift the curves from their catalog positions.
Minimum Time Margin Between Curves
Utility coordination practice commonly targets a minimum time separation in the range of 0.1 s–0.4 s between the Bay-O-Net’s total clearing curve and the recloser’s fast-curve at any given current point, though this margin is generally set by each utility’s own protection coordination standard rather than a single fixed IEEE requirement — the coordination-time-interval concept referenced in IEEE Std 242 (Recommended Practice for Protection and Coordination of Industrial and Commercial Power Systems) provides a general framework, but the specific numeric margin should always be confirmed against the local utility’s coordination guide. Margins narrower than this can be defeated by normal manufacturing tolerance on the fuse link itself, which typically runs several percent on melting time even within the same production batch.
Adjusting for Cold-Load Pickup and Inrush
Two conditions routinely shift the effective operating point away from the steady-state curve and need to be checked separately rather than assumed to fall within the standard margin.
Cold-load pickup occurs after an extended outage, when accumulated thermostatic loads (heating, air conditioning, water heaters) all reconnect simultaneously, producing sustained currents well above normal load — sometimes 2–4 times rated current for tens of seconds rather than milliseconds. This duration is long enough to intersect the lower portion of both curves, so the margin needs re-checking at that specific point, not just at short-duration fault currents.
Transformer inrush, by contrast, is a brief high-magnitude event, typically 8–12 times rated current for well under one second, decaying rapidly. Because it’s brief, some recloser fast-curves incorporate a short time delay or inrush restraint setting specifically to ride through it without treating it as a fault — confirming whether that setting is active is part of verifying the margin, not something to assume from the relay’s nameplate function.
Coordination Margin Reference Table
Condition
Typical Current Range
Duration
Margin Check Focus
Steady-state fault
800 A–4,000 A
Sub-second to few seconds
Standard 0.1–0.4 s vertical separation
Transformer inrush
8–12× rated current
<1 s, decaying
Recloser inrush restraint / delay setting
Cold-load pickup
2–4× rated current
10s–100s of seconds
Lower-curve intersection point
Verifying these margins against real relay settings, rather than generic catalog curves, is the difference between a coordination study that holds in the field and one that only holds on paper.
[Expert Insight]
A margin that passes at the endpoints of the fault range can still fail at a mid-range current — always spot-check the middle, not just the extremes.
Cold-load pickup is easy to overlook because it isn’t a “fault” in the traditional sense, yet its duration is long enough to intersect protection curves.
Confirm whether the recloser’s inrush restraint setting is actually enabled — it’s a common assumption that goes unverified until a nuisance trip occurs.
Field Verification and Commissioning Checks
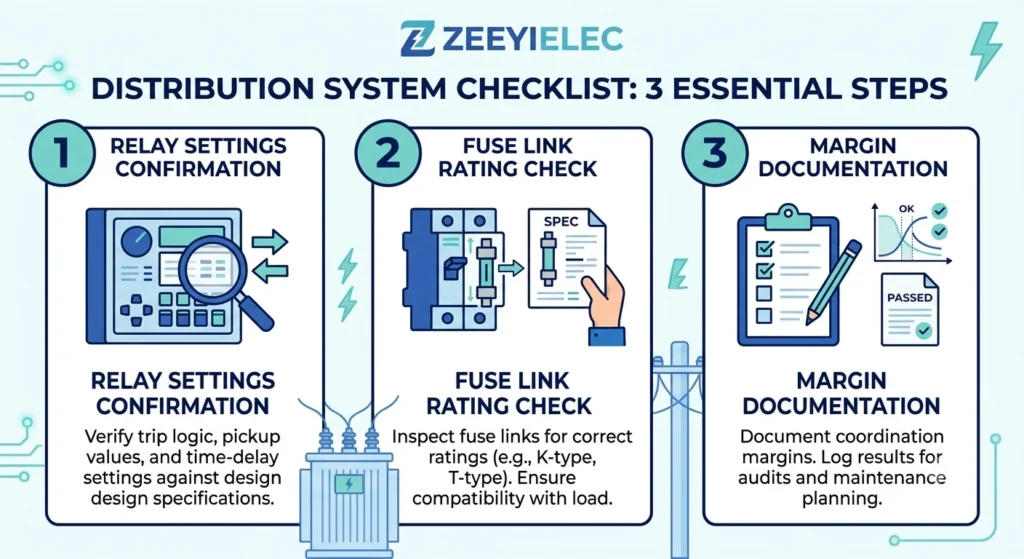
A coordination study completed on paper still needs field verification before a transformer goes into permanent service, because settings applied at the relay or drawn from a manufacturer’s generic curve don’t always match what’s actually programmed and installed on site.
Confirming the Recloser’s Actual Programmed Curve
The single most common gap between a paper study and field reality is that the recloser’s curve family, multiplier, or time-dial setting was changed after the coordination study was completed — sometimes by a different engineering team responding to an unrelated feeder issue. Before energizing a new transformer connection, pulling the recloser’s current settings directly from the relay (not from the original design drawing) and re-confirming they match the study is a five-minute check that catches a meaningful share of field miscoordination cases.
Verifying the Installed Fuse Link Rating
A second frequent field discrepancy is a fuse link installed at a different rating than the one specified in the coordination study — commonly because a field crew substituted an available link during an emergency repair without updating the study. Confirming the installed link’s rated current, typically somewhere in the 2 A–50 A range for Bay-O-Net applications depending on transformer kVA, against the study’s assumed rating should be part of any commissioning checklist rather than left to the original design paperwork.
Documenting the As-Left Coordination Margin
Once both values are confirmed, recording the actual margin observed at two or three representative fault current points — not just noting “coordination confirmed” — gives future engineers a baseline to compare against if the feeder configuration changes later. This as-left documentation is also what field teams reference during post-event failure diagnosis, following a structured root-cause workflow rather than ad hoc troubleshooting.
Commissioning verification confirms the recloser’s programmed curve, the installed fuse link rating, and documents the as-left coordination margin for future reference.
Common Coordination Mistakes and How to Correct Them
Most coordination failures in the field trace back to a small set of recurring errors, each of which is straightforward to correct once identified.
Mistake: Ignoring Ambient Temperature Derating
Bay-O-Net fuse link melting curves are typically published at a reference ambient temperature, often 25°C, but distribution transformers operate across a much wider range — from below freezing to well over 40°C in enclosure environments during summer peak load. A fuse link operating at elevated ambient temperature melts faster than its published curve suggests, since it starts closer to its thermal threshold before any fault current is applied. Engineers who compare curves without an ambient correction sometimes see a margin that looked adequate on paper erode or disappear entirely during a summer peak-load fault event. The correction is usually a manufacturer-supplied derating factor rather than a fixed percentage, so pulling that factor from the specific fuse link’s datasheet — not applying a generic industry rule of thumb — is the reliable approach.
Mistake: Using Manufacturer Curves Without Site Fault Data
A second recurring mistake is running the entire coordination study using only the manufacturer’s published fuse curve and the recloser’s generic relay curve, without ever calculating the actual available fault current at the transformer’s specific location on the feeder. Available fault current varies significantly by position on a feeder — a transformer near the substation might see fault currents several times higher than one at the end of a long rural feeder segment — and a margin that holds at one fault current level can fail at another. Pulling the site-specific fault current from a short-circuit study, rather than assuming a feeder-wide average, is what separates a coordination study that holds under actual conditions from one that only holds under idealized ones.
Mistake: Treating the Study as a One-Time Exercise
Feeder reconfigurations, relay firmware updates, and fuse link substitutions during emergency repairs all shift the curves without necessarily triggering a re-study. Building a periodic re-verification step — even an informal one during routine maintenance visits — into the maintenance cycle catches drift before it causes an outage rather than after.
Sourcing Coordinated Bay-O-Net Assemblies for Your Project
Getting coordination curves right starts with having accurate, verifiable fuse link data at the specification stage — not reverse-engineering it after installation. ZeeyiElec’s transformer accessories portfolio, including Bay-O-Net fuse assemblies for the 15/25 kV distribution class, is supplied with link ratings from 2 A up to 50 A to match transformer capacities from roughly 25 kVA to 500 kVA, and full TCC curve documentation is provided to support coordination studies before order placement rather than after a field issue surfaces.
For projects where Bay-O-Net coordination is being evaluated alongside upstream protection or a backup current limiting fuse, having both the melting and total clearing curves in hand — along with BIL and interrupting rating data — lets an engineering team complete the overlay analysis described above with real product data instead of generic catalog estimates.
ZeeyiElec’s Bay-O-Net fuse assemblies span the 15/25 kV distribution class with link ratings from 2 A to 50 A.
Explore the full cable accessories range if your project also involves downstream cable termination coordination, or review the Transformer Accessories RFQ Checklist, which outlines the parameters needed for an accurate quotation across bushings, fuses, and switching devices in a single package.
Frequently Asked Questions
How much time margin is needed between a Bay-O-Net curve and an upstream recloser curve?
Coordination margins are typically evaluated in the range of a few hundred milliseconds to several tenths of a second between curves, though the exact figure depends on the specific recloser relay settings and utility coordination practice, so site-specific study is required.
Can a Bay-O-Net fuse coordinate with a downstream current limiting fuse and an upstream recloser at the same time?
Yes, three-tier coordination is common in distribution protection schemes, but it requires plotting all three TCC curves together and confirming margins hold across the full fault current range, not just at a single point.
What causes a recloser to trip before the Bay-O-Net fuse clears a fault?
This usually happens when the recloser’s fast-curve setting is too aggressive relative to the fuse’s melting time at that current level, often worsened by underestimating fault current or ignoring ambient-temperature derating on the fuse link.
Does transformer inrush current affect coordination curve analysis?
Yes, inrush current can momentarily approach fault-current magnitudes, so coordination curves should be checked against typical inrush duration and magnitude to avoid nuisance recloser operations during energization.
How often should coordination curves be re-verified after initial commissioning?
Re-verification is generally recommended after any upstream relay setting change, transformer replacement, or fuse link substitution, since any of these shifts the curves and can silently erode the margin that was originally verified.
Is coordination curve analysis different for oil-immersed versus other transformer types?
The underlying TCC methodology is the same, but oil-immersed distribution transformers using Bay-O-Net assemblies typically reference fault-clearing data specific to submerged fuse-link behavior, which can differ slightly from dry-type protection data.
yoyo shi
Yoyo Shi writes for ZeeyiElec, focusing on medium-voltage accessories, transformer components, and cable accessory solutions. Her articles cover product applications, technical basics, and sourcing insights for global electrical industry buyers.





 English
 한국어
한국어 العربية
 Español
 हिन्दी
 தமிழ்
தமிழ் Deutsch (Sie)
 Français
 Português do Brasil
 Русский