What a Tap Range Is and Why Distribution Transformers Need One
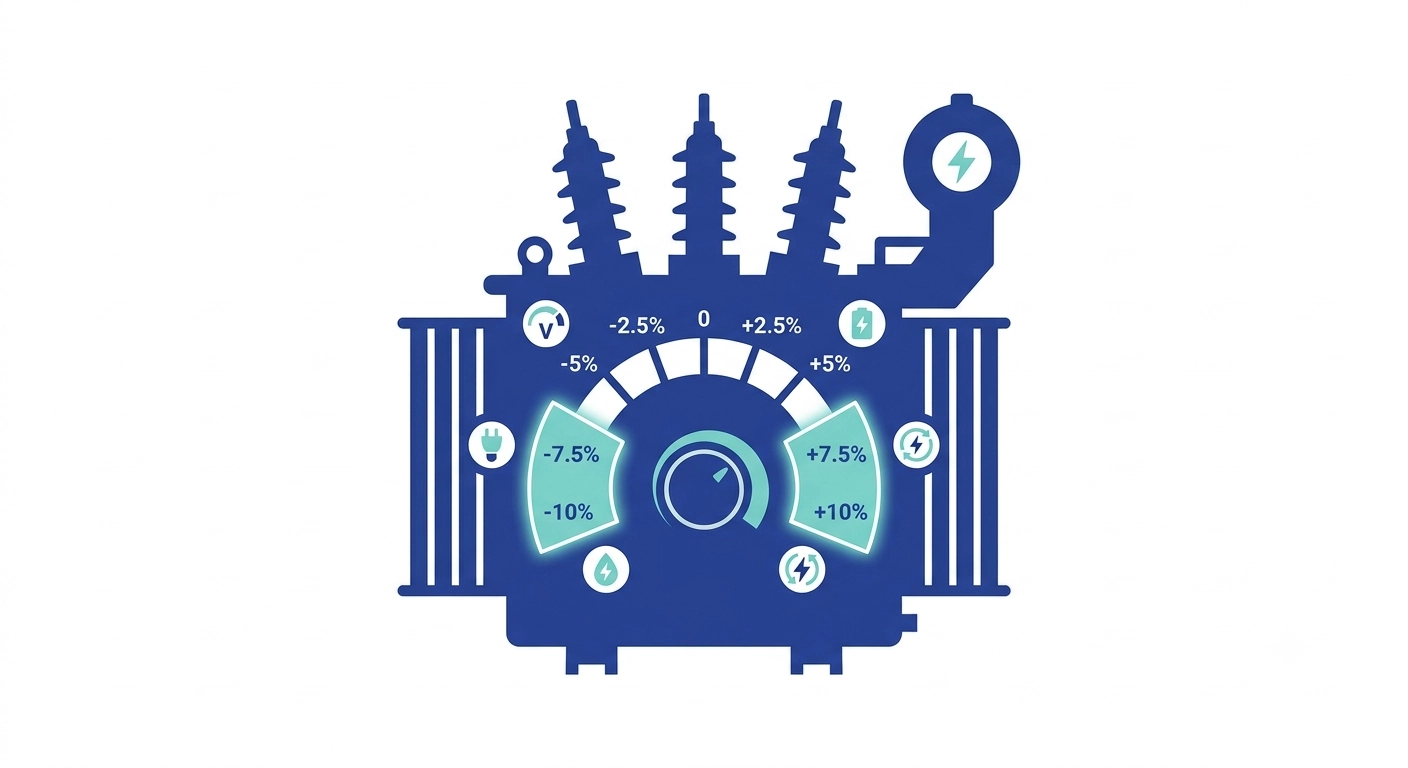
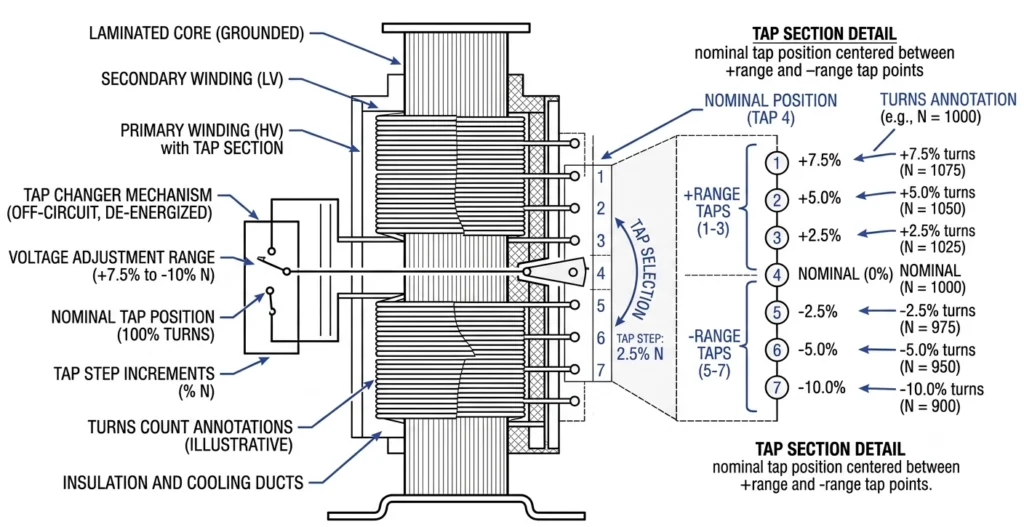
Tap range for distribution transformer projects determines how much a tap changer can correct secondary voltage as supply conditions vary. On most distribution transformers this window spans ±5% to ±10% of nominal voltage, split across a fixed number of discrete tap positions rather than continuous adjustment. The mechanism sets a fixed ratio correction that stays in place until the next planned outage — it does not regulate voltage dynamically under load, which is the role of an on-load tap changer on power transformers.The primary winding includes several tap points, each connecting a slightly different number of turns. Selecting a tap closer to the winding’s start or end shifts the effective turns ratio, moving secondary voltage up or down by a known increment. A ±5% window typically offers five positions in 2.5% steps; a ±10% window often spreads five positions across 5% steps, though this varies by manufacturer and kVA class.
A transformer near the substation typically sees tighter voltage stability than one at the tail end of a long feeder, where voltage drop under peak load can push secondary voltage outside acceptable limits without a compensating adjustment. Getting this figure wrong at the specification stage isn’t correctable in the field — winding taps are fixed at manufacture, so an under-sized window leaves no margin for actual site conditions, while an oversized one adds unnecessary winding complexity and cost.
Each tap point connects a different number of winding turns, allowing the tap changer to shift the effective turns ratio in fixed percentage increments.
Range vs Step vs Number of Positions
Range is the total percentage window (for example, ±5%). Step is the increment between adjacent positions (for example, 2.5%). Position count is what the two combine to produce — a ±5% window at a 2.5% step yields five positions.
Core Inputs That Determine the Required Adjustment Window
Four categories of data need collecting before any percentage figure goes into a specification.
Supply-Side Voltage Variation
Primary-side voltage on a distribution feeder can swing by ±5% to ±8% of nominal across a daily load cycle, wider on feeders with heavy industrial switching or seasonal pumping. This should come from an actual voltage survey at the connection point, not an assumed value.
Transformer Impedance and Voltage Drop
Impedance (Z%) directly affects secondary voltage sag under load, independent of primary-side variation. A distribution transformer with impedance typically in the 4% to 6% range shows measurable secondary drop near full load, and this adds to — not substitutes for — the margin the tap window must cover.
ΔVsecondary ≈ Iload × Z% (as a fraction of rated voltage, adjusted for power factor)
Pull impedance from the factory test report, not the catalog default, since actual values vary within manufacturing tolerance.
Load Profile and Regulation Target
Load profile determines how much drop occurs between light-load and peak-load conditions. The regulation target — commonly ±5% of nominal — defines what secondary band is acceptable downstream. A feeder with variable industrial load needs a different window than one serving stable residential load at identical primary variation, because the secondary-side swing compounds differently.
[Expert Insight]
Use the factory test report for impedance, not the nameplate default
A survey covering only off-peak hours understates real variation — insist on a full peak-demand cycle
Weight the load profile input toward transient sag for sites with large motor-starting current
Step-by-Step Method to Calculate the Adjustment Window
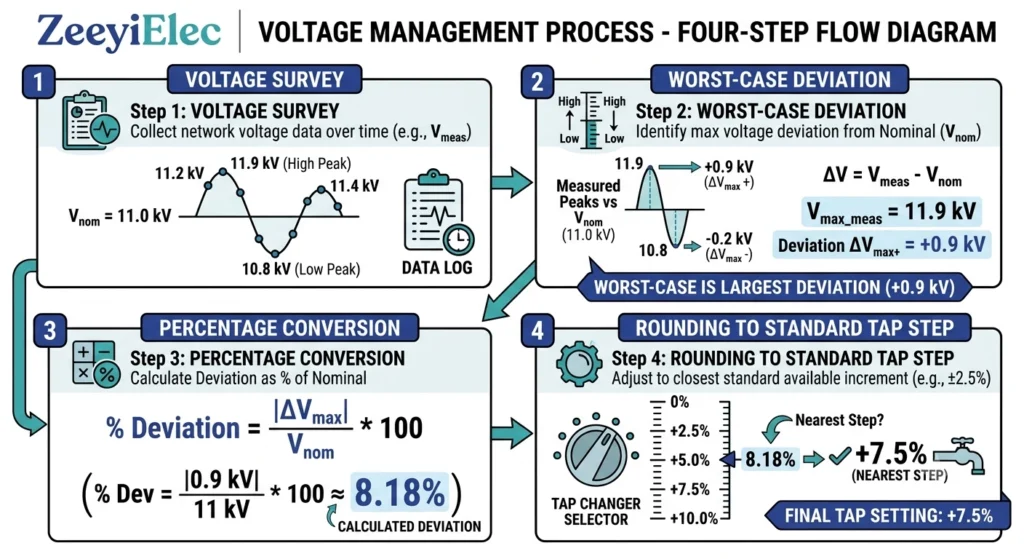
Step 1 — Collect Voltage Survey Data
Record minimum and maximum primary voltage over a representative period. Example: nominal 11 kV, recorded swing between 10.45 kV and 11.55 kV — a ±5% variation.
Step 2 — Determine Worst-Case Deviation
Add the expected secondary-side drop from impedance under peak load to the larger primary-side deviation. At 4.5% impedance and near-full-load operation, this drop compounds with the low-voltage condition, since both push secondary voltage the same direction.
Step 3 — Convert to a Required Percentage
Required range (%) ≈ Primary voltage deviation (%) + worst-case impedance drop (%) at peak load, evaluated separately for the low-voltage and high-voltage conditions
Here, a 5% low-voltage condition plus a 4.5% impedance drop points toward ±10% rather than a lighter ±5% unit.
Step 4 — Round to Standard Steps
Standard step increments — commonly 2.5% — mean a calculated 8.7% need rounds up to ±10% at 2.5% steps rather than a non-standard fraction. On rural feeder projects, this rounding step is frequently skipped, which forces the supplier back with a clarification request and adds a procurement cycle.The tap range calculation sequence moves from voltage survey data through impedance drop compounding to a final rounded tap step selection.
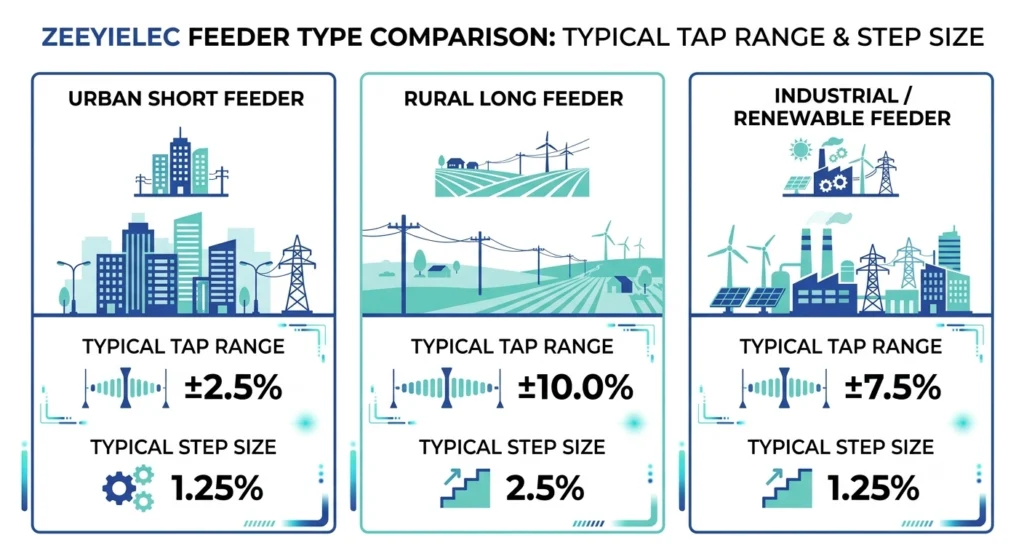
Variation within ±2.5% to ±5% is typical near a substation on short, well-regulated feeders. A ±5% window at a 2.5% step is usually sufficient.
Rural/Long Feeder Applications
Swings of ±8% to ±10% are common at the tail end of long lines, compounded by impedance drop under seasonal peak load. ±10% is the common baseline; some utilities specify wider custom windows for marginal feeders.
Industrial and Renewable-Heavy Feeders
Reverse power flow from embedded generation can push local voltage above nominal during low-demand periods, while motor starting causes transient sags. ±10% is typical, sometimes weighted asymmetrically toward the high-voltage side.
Table: Typical Values by Scenario
Scenario
Typical Primary Variation
Common Range
Common Step
Urban / short feeder
±2.5%–5%
±5%
2.5%
Rural / long feeder
±8%–10%
±10%
2.5%–5%
Industrial / renewable-heavy
Variable, bidirectional
±10%
2.5%
Typical tap range requirements vary by feeder type, from tighter urban windows to wider rural and industrial-generation scenarios.
These bands assume standard off-circuit tap changer construction; unusual voltage profiles still warrant the full calculation.
Field Conditions That Push the Window Wider or Narrower
Weak Grid Segments and Seasonal Load Swings
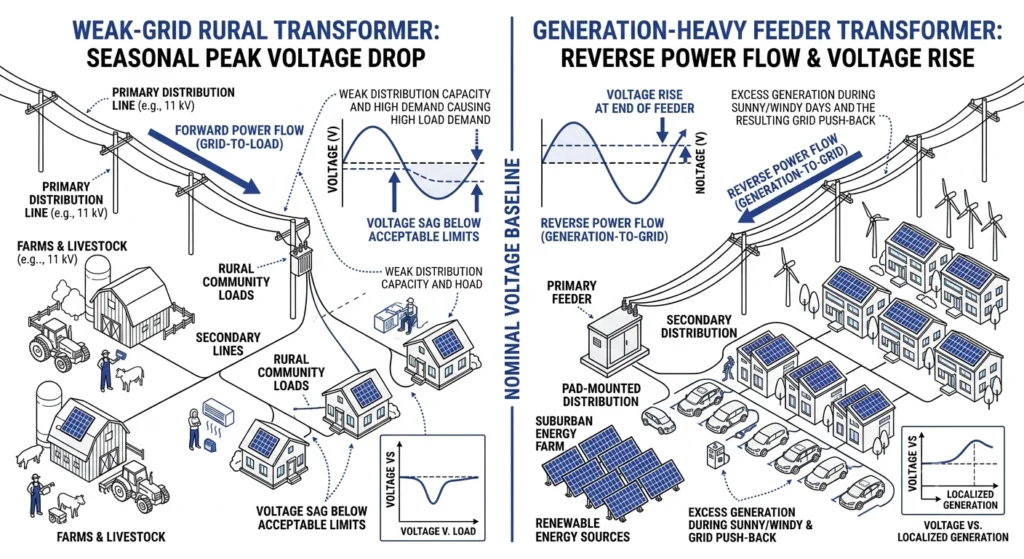
A “weak” segment — high source impedance relative to load, often at the far end of a long line — can show seasonal swings exceeding 10% even when the annual average looks closer to 6% to 7%. Sizing to the worst recorded seasonal peak, not the annual average, avoids under-ranging.
Distributed Generation and Reverse Power Flow
When embedded generation output exceeds local consumption, power flows back toward the substation and can push secondary voltage above nominal — sometimes by 5% or more. This reverses the traditional rural-feeder concern, where risk is almost always low voltage rather than high.Weak-grid segments push tap range wider from seasonal voltage drop, while generation-heavy feeders require margin for reverse-flow voltage rise.
[Expert Insight]
On weak-grid segments, size to the worst seasonal peak, not the annual average
Generation-heavy feeders need margin for voltage rise, not just drop
Cross-check against a prior season’s data when a single survey window is unreliable
Common Mistakes When Specifying the Adjustment Window
Under-Specifying
Getting tap range for distribution transformer projects right at the specification stage avoids two recurring errors. A project sized only to a 5% primary swing without the additional 3% to 5% typical drop often arrives with a window too narrow for peak demand — and tap positions can’t be corrected after manufacture.
Over-Specifying
A quieter version of this mistake is copying a “standard” figure from a prior project without re-running the calculation for the new site — two feeders at the same nominal voltage can have very different variation profiles. Tapping range and tapping factor notation are formally defined in Clause 5 of IEC 60076-1, while the method for translating loading cases and service voltage variation into a specific tapping range is covered in IEC 60076-8; neither standard prescribes a universal “correct” range, so a prior project’s figure should always be re-verified against current site data before reuse.
A well-structured RFQ line item should include the calculated figure (for example, ±10%), the preferred step (commonly 2.5%), and the underlying data — nominal primary voltage, recorded variation, and impedance — so the supplier’s engineering team can flag mismatches before manufacturing starts.
Site context matters as much as the numbers: note whether the installation sits on a weak grid segment, carries seasonal swings, or connects to distributed generation, since this informs adjustments a bare percentage figure wouldn’t communicate. For projects covering multiple accessory families, this data should be specified alongside bushing voltage class, BIL, and fuse coordination parameters rather than submitted separately. Projects that also specify cable-side components can reference ZeeyiElec’s cable accessories line for parallel selection guidance during the same RFQ cycle.
ZeeyiElec’s engineering team reviews these calculations as part of standard RFQ handling for off-circuit tap changer specifications. Full parameter guidance is available in ZeeyiElec’s transformer accessories RFQ checklist.
Frequently Asked Questions
What is a typical tap range for distribution transformer projects?
Most distribution transformers use a window between ±5% and ±10% of nominal voltage, depending on primary voltage variation and impedance at the specific site. Stable, short-line supply tends toward the narrower end; long rural feeders typically need the wider figure.
How many tap positions does a standard off-circuit tap changer have?
Standard configurations commonly offer five positions, though the count depends on the combination of total range and step size selected. A ±5% window at a 2.5% step and a ±10% window at a 5% step both commonly produce five positions with different voltage increments.
Can tap range be changed after a transformer is manufactured?
No — tap positions are fixed at the winding stage, so an under- or over-sized window can’t be corrected in the field without rewinding or replacing the unit. This is why the calculation needs to happen accurately before the purchase order is placed.
Does tap range affect transformer impedance or losses?
It doesn’t directly change rated impedance, but a wider window with more positions can introduce small variations in impedance between settings. These are generally minor for standard distribution-class units but worth confirming with the supplier for tight regulation requirements.
How does load profile influence the required tap range?
A feeder with wide swings between light and peak load compounds primary-side variation with impedance drop, pushing the required window wider than primary variation alone would suggest. Stable, predictable profiles typically allow a narrower window than industrial or seasonal agricultural demand.
What happens if the tap range is too narrow for site voltage conditions?
Secondary voltage falls outside acceptable regulation limits during worst-case conditions, with no available position to compensate. Correction generally means accepting out-of-tolerance service until the next transformer change-out.
Is tap range the same as voltage regulation?
No — this is a fixed, manually-selected correction set at commissioning or during planned outages, while voltage regulation typically refers to dynamic, load-responsive control on on-load tap changers used with power transformers. Off-circuit units rely on the fixed window to correct for known, relatively stable conditions rather than moment-to-moment fluctuation.
yoyo shi
Yoyo Shi writes for ZeeyiElec, focusing on medium-voltage accessories, transformer components, and cable accessory solutions. Her articles cover product applications, technical basics, and sourcing insights for global electrical industry buyers.





 English
 한국어
한국어 العربية
 Español
 हिन्दी
 தமிழ்
தமிழ் Deutsch (Sie)
 Français
 Português do Brasil
 Русский