A 15 kV cold shrink termination fails at month fourteen. The installation crew blames the accessory. Procurement suspects a counterfeit batch. The site engineer points to a recent lightning event. Three theories, one failure, zero certainty—and a replacement already on order before anyone examines the evidence.
Systematic field failure diagnosis isolates root causes before repeat failures occur. By following a structured workflow, field engineers identify what actually failed, why it failed, and what conditions allowed the failure to develop. This five-stage process applies to cable accessories, transformer bushings, tap changers, fuses, and related components installed across medium-voltage networks.
The workflow proceeds through: (1) scene assessment and evidence preservation, (2) failure mode classification, (3) root cause hypothesis development, (4) diagnostic testing sequence, and (5) root cause confirmation with corrective action. Skip a stage, and the final conclusion becomes speculation rather than engineering judgment.
Random troubleshooting—swapping parts, adjusting settings, hoping the problem resolves—treats symptoms while root causes persist. A transformer bushing that fails from moisture ingress will fail again if the breather or gasket seal remains compromised. A cable termination that overheats due to undersized conductor crimps will repeat the failure regardless of how many premium accessories replace it.
Field observations across 150+ failed terminations recovered from utility networks reveal that over 70% of premature failures trace to three primary mechanisms: moisture ingress, thermal degradation, and electrical stress concentration at interfaces. Each mechanism leaves distinctive signatures that systematic diagnosis can identify.
The cost of misdiagnosis compounds rapidly. Beyond material and labor for repeated replacements, organizations lose confidence in equipment, suppliers, and installation practices. Documentation generated during proper diagnosis protects warranty claims, informs procurement decisions, and builds institutional knowledge that prevents future incidents.
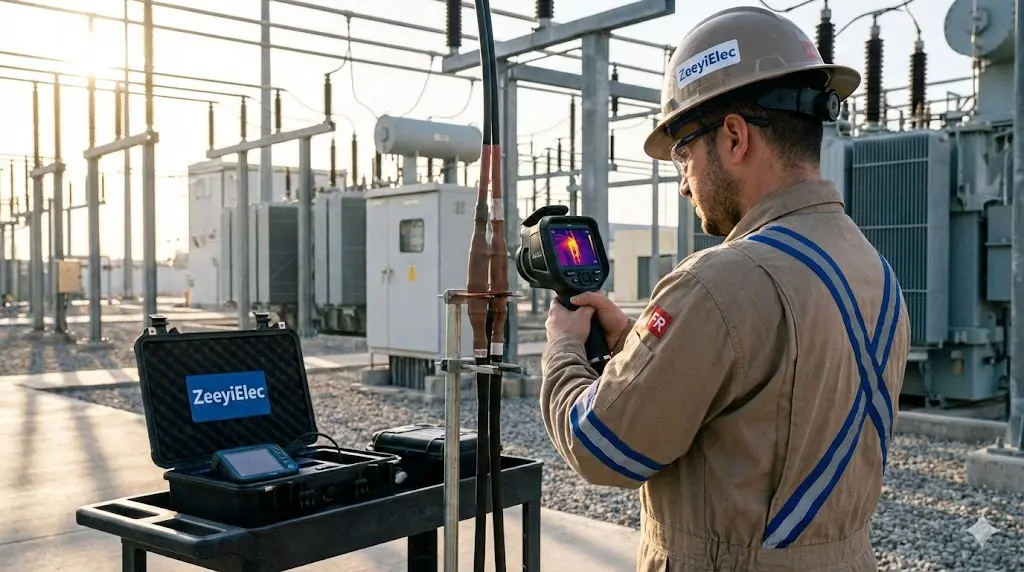
Stage 1 — Scene Assessment and Evidence Preservation
Safety isolation comes first. Confirm lockout-tagout before approaching failed equipment.
Document before disturbing. Smartphone photos from four or more angles capture details lost during handling—arc tracking paths, oil stains, displaced seals, corrosion patterns. Record ambient conditions: temperature, humidity, load history if available, weather events in the preceding 72 hours.
Physical evidence commonly destroyed before documentation includes:
Cable jacket condition 300 mm upstream and downstream of the failure point
Fuse link physical state: melted versus mechanically separated versus intact
Tap changer oil color and odor (burnt smell indicates thermal event)
Bag and label all removed components for potential laboratory analysis. Cleaning or cutting failed parts before photography destroys failure signatures that determine root cause.
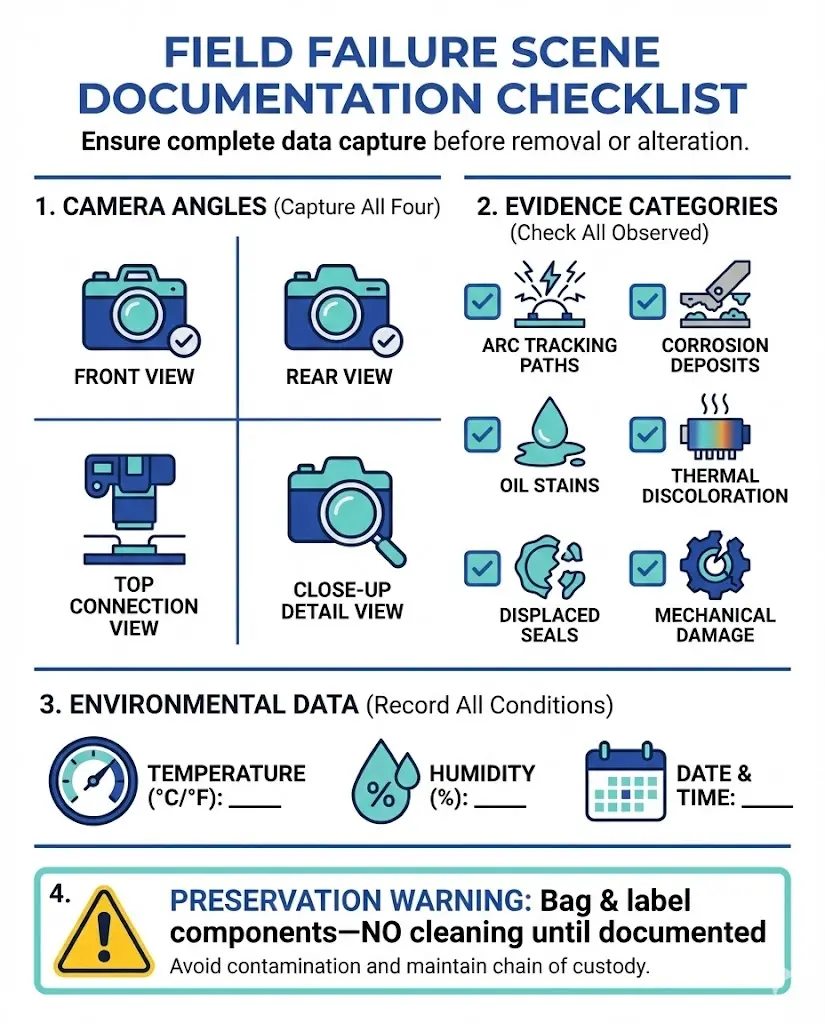
Figure 1. Scene documentation checklist for Stage 1 evidence preservation—photograph from minimum four angles before disturbing failed components.
[Expert Insight: Evidence That Disappears First]
Fingerprints and contamination films at insulation interfaces oxidize within 48 hours of exposure
Thermal discoloration patterns fade as components cool to ambient
Moisture trapped in voids evaporates once seals are breached during disassembly
Document oil levels and colors in situ—drainage alters diagnostic signatures
Stage 2 — How to Classify Electrical Failure Modes
Classification directs subsequent hypothesis development. Most field failures involve multiple categories—thermal stress initiates damage, moisture accelerates breakdown, mechanical displacement exposes interfaces to contamination.
When examining cable accessory failures, thermal and dielectric modes frequently overlap. Sustained conductor temperatures exceeding 90°C accelerate EPDM aging through oxidation and polymer chain scission. This degradation manifests as hardening—Shore A durometer increasing from 50 to 70+—cracking at stress concentration points, and eventual loss of radial compression below the critical 0.2 MPa threshold required for effective sealing.
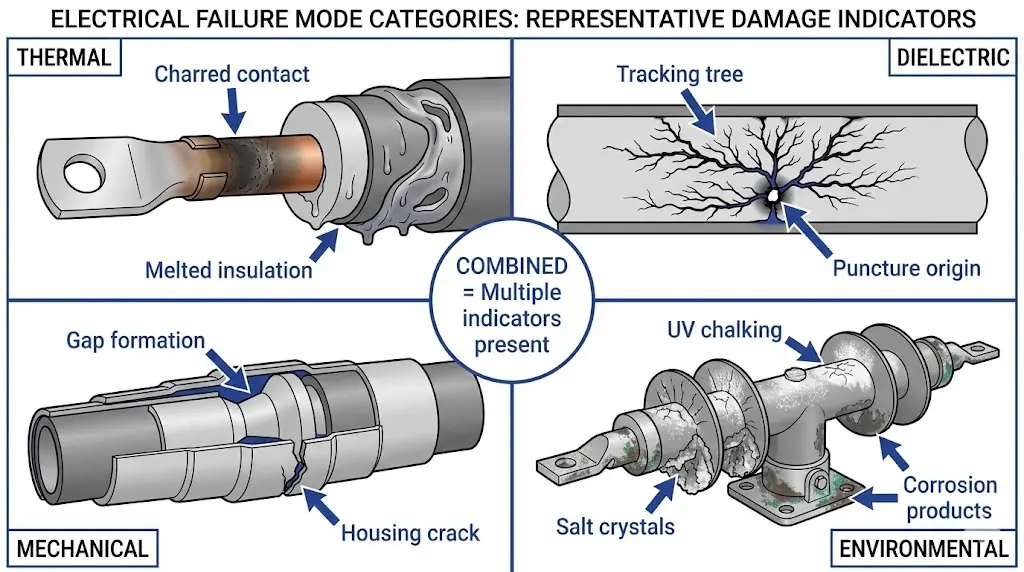
Figure 2. Failure mode classification matrix—thermal and dielectric failures often overlap, with initial thermal stress accelerating subsequent dielectric breakdown.
Stage 3 — Building a Root Cause Hypothesis Tree
For each failure category identified in Stage 2, develop hypothesis branches based on physics and field realities.
Inadequate contact surface preparation increasing resistance at interfaces
Ambient temperature excursions beyond rated operating limits
Blocked ventilation causing heat accumulation in enclosed compartments
Dielectric Failure Hypotheses:
Geometric stress concentration at the semiconductor screen cutback
Interface contamination from fingerprints, dust, or moisture films
Material incompatibility—silicone grease degrading EPDM compounds
Overvoltage transients from switching surges or lightning impulse
Mechanical Failure Hypotheses:
Insufficient cold shrink spring tension allowing relaxation over thermal cycles
Thermal expansion mismatch at material interfaces
Vibration fatigue loosening bolted connections
Installation damage from improper bending radius or tool marks
Environmental Failure Hypotheses:
UV degradation causing polymer chain scission on exposed surfaces
Salt fog depositing conductive films that reduce creepage effectiveness
Condensation cycling driving moisture into unsealed interfaces
Chemical attack from industrial pollutants or agricultural chemicals
Rank hypotheses by consistency with observed evidence, known installation history, and component age. Avoid premature elimination—test data confirms or refutes. In diagnostic assessments of transformer accessory components, the primary root cause often differs from initial assumptions once testing completes.
Stage 4 — Diagnostic Testing Sequence for Field Failures
Testing should answer specific hypothesis questions, not “check everything.” Sequence matters: non-destructive field tests preserve evidence for laboratory analysis if required.
Non-Destructive Field Tests:
Test Method
What It Reveals
Equipment
Threshold Values
IR thermography
Hot spots, thermal gradients
IR camera (min 320×240)
>15°C differential warrants investigation
Partial discharge
Incipient insulation defects
TEV, UHF, or acoustic sensor
<10 pC healthy; >50 pC indicates active degradation
Insulation resistance
Gross dielectric degradation
Megohmmeter (5 kV DC)
<100 MΩ indicates contamination
Contact resistance
Connection integrity
Micro-ohmmeter (DLRO)
>100 μΩ at bolted joint warrants action
Polarization index testing provides additional diagnostic precision for moisture assessment. The ratio of 10-minute to 1-minute insulation resistance readings below 2.0 suggests moisture absorption in the cable accessory dielectric system.
Laboratory Tests (Post-Removal):
Test Method
What It Reveals
When Required
Dissection and microscopy
Internal defect morphology, failure origin
Warranty claims, litigation
Dissolved gas analysis
Thermal/electrical fault history
Oil-filled bushings, tap changers
FTIR spectroscopy
Material degradation, contamination ID
Polymeric component failures
According to IEEE 400.2 guidelines for field testing shielded power cable systems, dielectric loss factor values exceeding 0.1 at VLF test frequencies indicate significant moisture contamination requiring immediate attention. For medium-voltage bushing diagnostics, dissolved gas analysis reveals thermal and electrical fault history that visual inspection cannot detect.
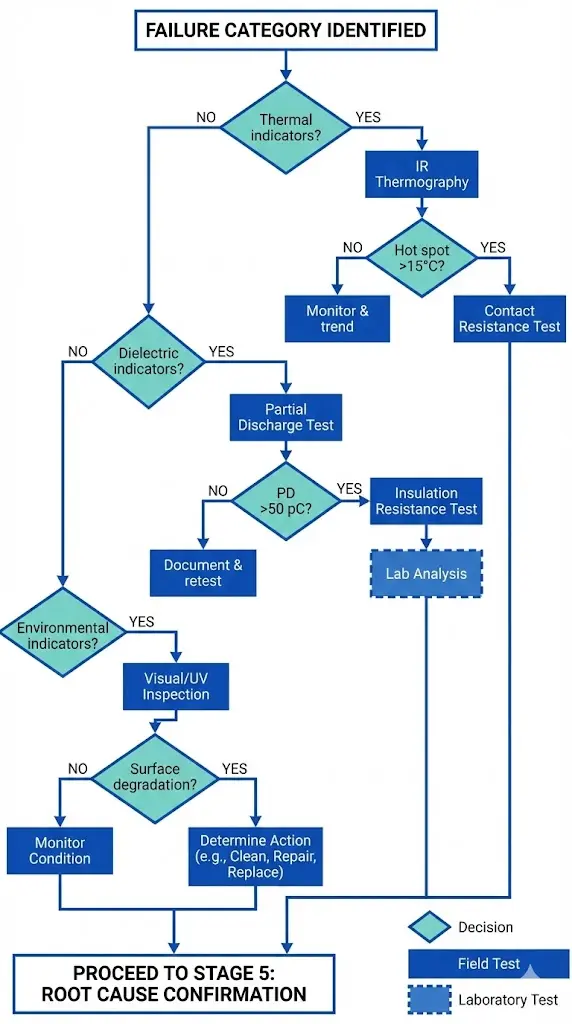
Figure 3. Diagnostic test decision tree for Stage 4—execute non-destructive field tests before laboratory analysis to preserve evidence integrity.
[Expert Insight: Test Sequence Optimization]
Conduct IR thermography under load—thermal signatures disappear within minutes of de-energization
PD measurements at 1.73 × U₀ stress the insulation system sufficiently to reveal latent defects
Contact resistance below 50 μΩ confirms healthy bolted connections; trending over time matters more than single readings
Reserve destructive testing until non-destructive methods prove inconclusive
Stage 5 — Confirming Root Cause and Preventing Recurrence
Converge test results against ranked hypotheses. If data contradicts the leading theory, return to Stage 3 rather than forcing conclusions. Document the failure chain: initiating event → propagation mechanism → final breakdown mode.
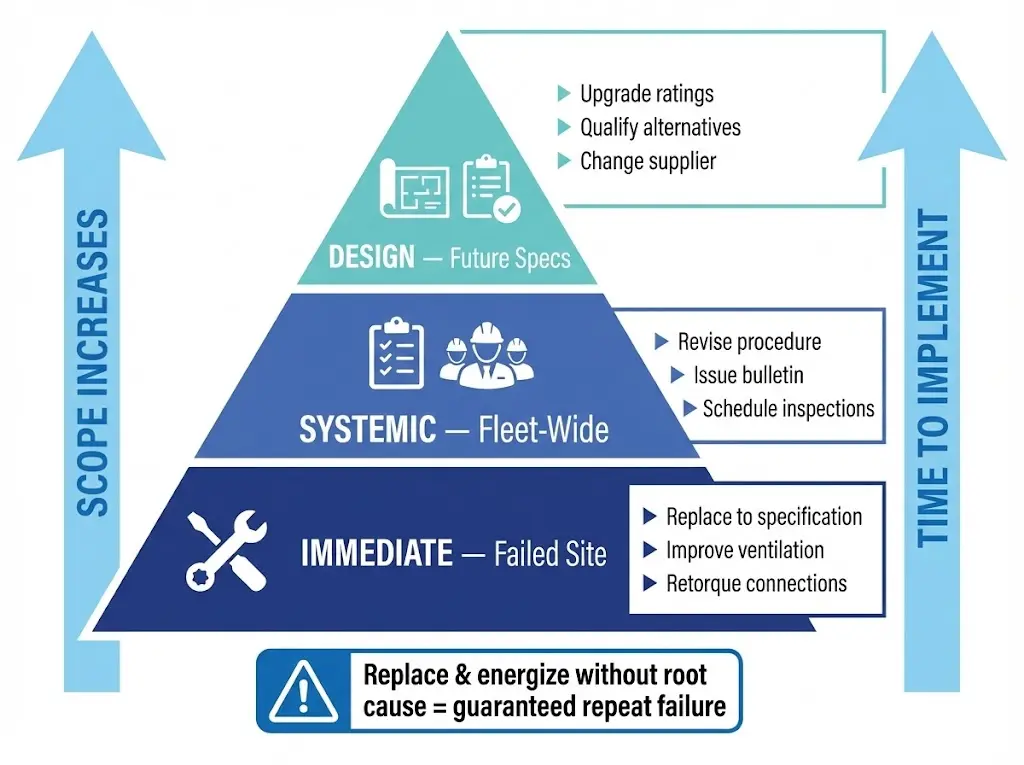
Three-Tier Corrective Action Framework:
Tier
Scope
Example Actions
Immediate
Failed site
Replace accessory to correct specification, improve ventilation, retorque connections
Systemic
Fleet-wide
Revise installation procedure, issue technical bulletin, schedule inspections of similar installations
Design/Procurement
Future specifications
Specify higher-rated components, qualify alternative materials, change supplier
“Replace and energize” without root cause confirmation guarantees repeat failures. Field experience demonstrates that installations experiencing premature failures often share common installation crews, material batches, or environmental conditions. Identifying these patterns transforms individual failure response into fleet-wide risk management.
Feed findings back to engineering, procurement, and training functions. Failure reports should answer three questions: What failed? Why did it fail? What prevents recurrence?
Figure 4. Three-tier corrective action framework for Stage 5—scope and implementation time increase from immediate site fixes to long-term design changes.
Field Diagnosis Workflow — Printable Quick-Reference
Three-tier corrective actions assigned and tracked
Prevent Field Failures with Quality Accessories from ZeeyiElec
Quality manufacturing represents the first line of defense against field failures. ZeeyiElec transformer accessories and cable accessories undergo material testing, dimensional verification, and quality documentation that supports reliable field performance.
Technical support extends beyond product delivery. Engineering consultation helps match accessory specifications to installation conditions—altitude, ambient temperature range, contamination class, and system voltage requirements all influence selection decisions.
Contact ZeeyiElec for product specifications, installation guidance, or technical consultation on accessory selection for your specific application requirements.
Frequently Asked Questions
Q: What percentage of cable accessory failures originate from installation errors versus manufacturing defects?
A: Field assessments consistently show 60–75% of premature failures trace to installation factors—improper stress cone positioning, inadequate surface preparation, or insufficient torque—while manufacturing defects account for less than 15% when quality-controlled accessories are specified.
Q: How quickly does partial discharge activity progress from initiation to complete failure?
A: Progression timelines vary from weeks to years depending on discharge magnitude and operating voltage stress; PD levels above 100 pC at operating voltage typically indicate months rather than years of remaining service life under normal loading conditions.
Q: Can thermal imaging detect failures in enclosed switchgear or junction boxes?
A: Infrared thermography requires line-of-sight to the target surface; enclosed installations may need inspection windows, or technicians can measure external enclosure temperatures and ambient differentials as indirect indicators of internal heating.
Q: What insulation resistance value confirms a cable accessory is safe to re-energize?
A: Insulation resistance above 1000 MΩ at 5 kV DC with polarization index exceeding 2.0 generally indicates acceptable dielectric condition; however, trending against baseline values provides more diagnostic confidence than absolute thresholds alone.
Q: How does altitude affect failure modes in outdoor terminations and bushings?
A: Reduced air density at elevations above 1000 m lowers dielectric strength of external air gaps by approximately 1% per 100 m, increasing surface discharge risk and requiring derating or extended creepage distance for equipment installed at high altitude.
Q: When should failed components be sent for laboratory analysis versus disposed?
A: Laboratory analysis is warranted for warranty claims, repeat failures at multiple sites, failures occurring well before expected service life, or situations where litigation may follow; cost-benefit favors disposal for isolated failures in aged equipment near end of life.
Q: What documentation should accompany a failed component sent for analysis?
A: Include installation date, operating voltage and load history, environmental conditions, failure date and circumstances, field test results, and photographs taken before removal—laboratories cannot reconstruct context that field personnel fail to document.
yoyo shi
Yoyo Shi writes for ZeeyiElec, focusing on medium-voltage accessories, transformer components, and cable accessory solutions. Her articles cover product applications, technical basics, and sourcing insights for global electrical industry buyers.